Air pollution caused in Mumbai
CITY-MUMBAI
(MAHARASHTRA, INDIA)
Mumbai, Bombay, Maximum City, with a population of 12.5 million is the most populated city in India. It has always been a city of huge economic significance in India because of its location on the Konkan coast and its deep natural harbour. It is the capital of the state of Maharashtra and is the de-facto commercial and financial capital of India.
Mumbai plays a central role in India’s economy and accounts for 25% of industrial output, 70% of maritime trade, and 70% of capital transactions of the country. The Reserve Bank of India, the Bombay and National Stock Exchanges, and the Securities and Exchange Bureau of India operate out of the city. It is a magnet that draws citizens from all parts of India in search of livelihood and the idea of making it work in Bombay. An idea that is typified by the Bollywood film industry – the epicentre of which is Mumbai.
South Bombay covers an area of about 70 square kilometers and suburban Bombay region extends over an area of 370 square kilometers. To keep up with its growth, the city has grown even further – the Mumbai Metropolitan Region covers an area of 4400 square kilometers. Mumbai Metropolitan Region was home to 20,748,395 people by 2011.
To assess Mumbai’s air quality, we selected an airshed covering 80km x 80km. This domain is further segregated into 1km grids, to study the spatial variations in the emission and the pollution loads.
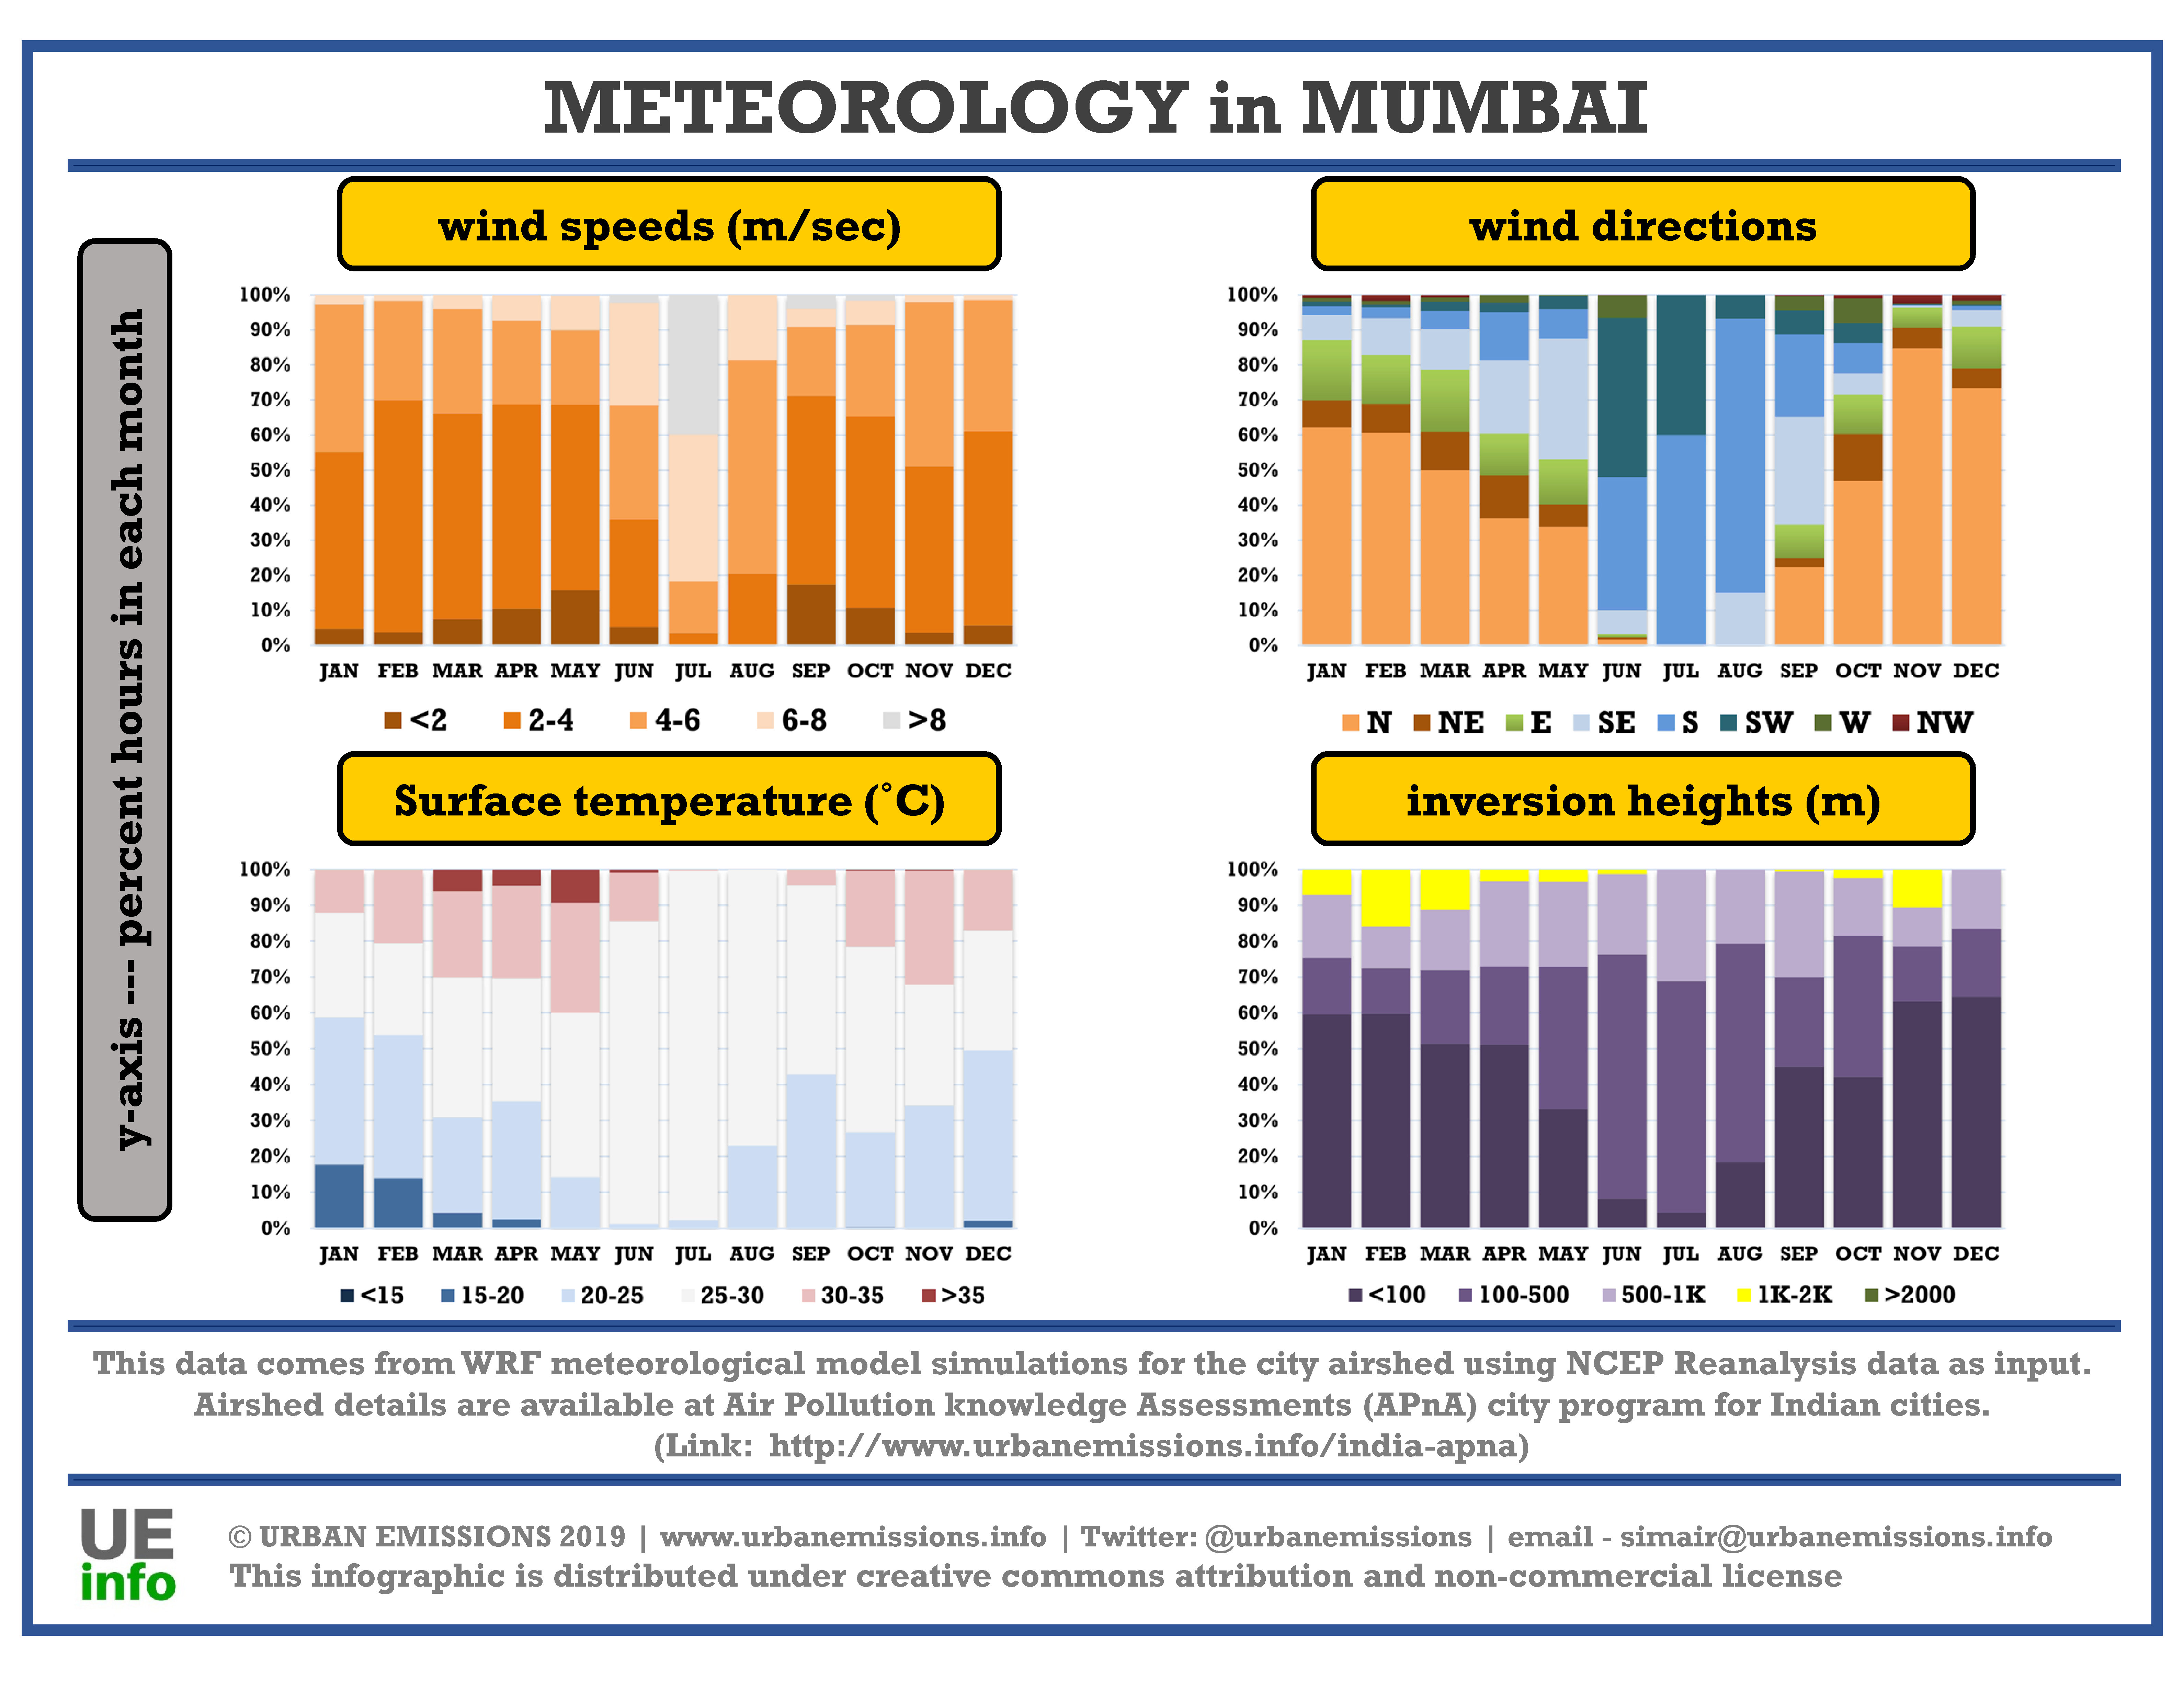
Meteorology fields are important as they have a direct impact on air pollution concentrations. During periods of high precipitation or high speed winds, emissions from a city are swept away and do not have an impact on concentrations. On the other hand, during the winter months when temperatures and inversion heights are low, there is a greater impact of emissions on pollution concentrations. Low temperatures also affect behaviour through the need for space and water heating – which in turn has increases emissions.We processed the NCEP Reanalysis global meteorological fields from 2010 to 2018 through the 3D-WRF meteorological model. A summary of the data for one year, averaged for the city’s airshed is presented below by month. Download the processed data which includes information on year, month, day, hour, precipitation (mm/hour), mixing height (m), temperature (C), wind speed (m/sec), and wind direction (degrees) – key parameters which determine the intensity of dispersion of emissions.

Multi-Pollutant Emission Inventory
We compiled an emissions inventory for the Mumbai region for the following pollutants – sulfur dioxide (SO2), nitrogen oxides (NOx), carbon monoxide (CO), non-methane volatile organic compounds (NMVOCs), carbon dioxide (CO2); and particulate matter (PM) in four bins (a) coarse PM with size fraction between 2.5 and 10 μm (b) fine PM with size fraction less than 2.5 μm (c) black carbon (BC) and (d) organic carbon (OC), for year 2015 and projected to 2030. In Phase 1, base year for all the calculations was 2015. In Phase 2, all the calculations are updated for year 2018.
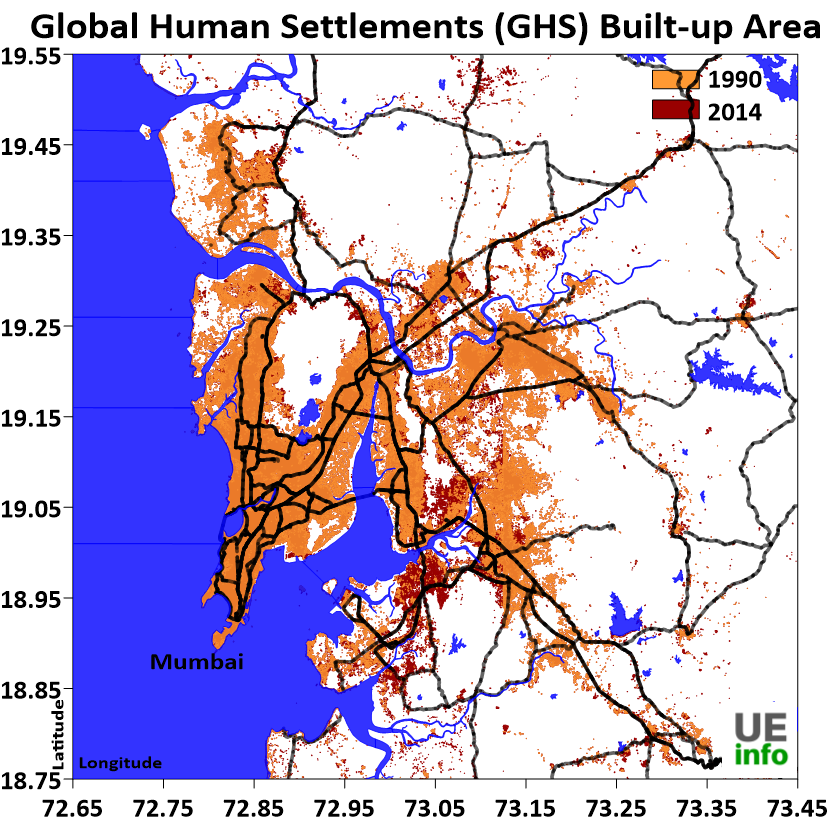
 We customized the SIM-air family of tools to fit the base information collated from disparate sources. Apart from the official reports, resource material ranges from GIS databases of land use, land cover, roads and rail lines, water bodies, built up area (represented in the adjacent figure), commercial activities (such as hotels, hospitals, kiosks, restaurants, malls, cinema complexes, traffic intersections, worship points, industrial hubs, and telecom towers), to population density and meteorology at the finest spatial resolution possible (1-km). A detailed description of these resources is published as a journal article in 2019, which also includes a summary of baselines and pollution analysis for 20 Indian cities.
This emissions inventory is based on available local activity and fuel consumption estimates for the selected urban airshed (represented in the grid above). This information is collated from multiple agencies ranging from the central pollution control board, state pollution control board, census bureau, national sample survey office, ministry of road transport and highways, annual survey of industries, central electrical authority, ministry of heavy industries, and municipal waste management, and publications from academic and non-governmental institutions.


Comments
Post a Comment